
Top 5 Waits In Last 1 Year – “DB file sequential read”
Database Low Performance
Angudi Tech
6/7/20262 min read
In a production environment, there are numerous factors that can lead to slow query performance in an Oracle database. It is essential to identify the top five waits that the database is experiencing. An event may have either a detrimental or beneficial effect. Therefore, a more in-depth examination of the issue is crucial to establish a lasting solution to the problem.
The following query provides the top 5 wait events that a database has experienced over the past year. Each event within the database holds significance, and its actions are influenced by other events or factors.
WITH event_deltas AS (
SELECT
h.event_name,
SUM(h.time_waited_micro - LAG(h.time_waited_micro) OVER (
PARTITION BY h.dbid, h.instance_number, h.event_id
ORDER BY h.snap_id
)) / 1000000 AS time_waited_seconds
FROM dba_hist_system_event h
JOIN dba_hist_snapshot s ON h.snap_id = s.snap_id
AND h.instance_number = s.instance_number
AND h.dbid = s.dbid
WHERE s.begin_interval_time >= SYSDATE - 365
AND h.wait_class != 'Idle'
GROUP BY h.dbid, h.instance_number, h.event_id, h.event_name, h.snap_id
)
SELECT * FROM (
SELECT
event_name,
SUM(time_waited_seconds) AS total_time_waited_sec
FROM event_deltas
WHERE time_waited_seconds > 0
GROUP BY event_name
ORDER BY total_time_waited_sec DESC
)
WHERE ROWNUM <= 5;
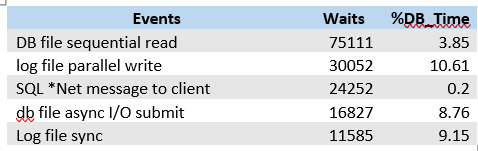
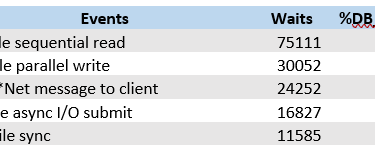
The most frequently consumed waits in a production database are listed below.,
Given that all these waits account for over 40% of database wait time, it is essential to comprehend the reasons behind their occurrence. Let us first explore "DB file sequential read," as it is responsible for consuming a significant amount of DB waits.
SELECT * FROM (
SELECT
ash.sql_id,
COUNT(*) as total_wait_samples,
ROUND(SUM(ash.time_waited) / 1000000, 2) as total_wait_time_secs,
ROUND(AVG(ash.time_waited) / 1000, 2) as avg_wait_time_ms
FROM
dba_hist_active_sess_history ash
JOIN
dba_hist_snapshot snap
ON ash.snap_id = snap.snap_id
AND ash.dbid = snap.dbid
AND ash.instance_number = snap.instance_number
WHERE
ash.event = 'db file sequential read'
AND snap.begin_interval_time >= ADD_MONTHS(SYSDATE, -12)
AND ash.sql_id IS NOT NULL
GROUP BY
ash.sql_id
ORDER BY
total_wait_samples DESC
)
WHERE ROWNUM <= 5;
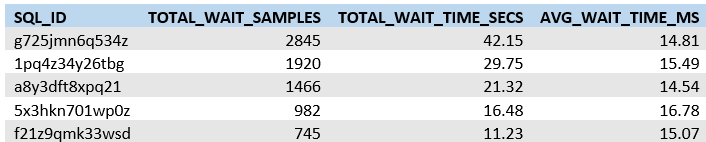
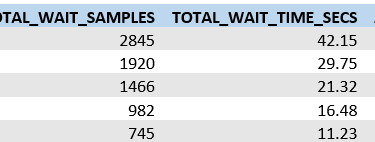
Above list presents the top 5 sql_ids that have contributed to the highest number of 'db file sequential read' events in the database over the past year. Among these, there are 3 SELECT statements, 1 DELETE statement, and 1 UPDATE statement. It is clear that these SQL queries are making significant use of indexes, as well as other elements such as nested loop joins, block transitions, foreign key validation, and row chaining migration, among others.
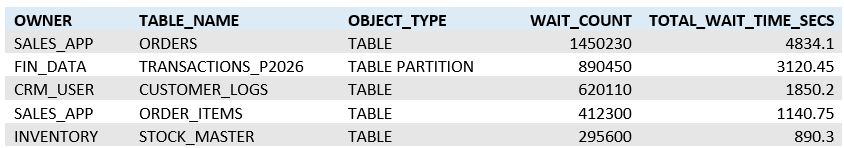
SELECT * FROM (
SELECT
o.owner,
o.object_name AS table_name,
o.object_type,
COUNT(*) AS wait_count,
ROUND(SUM(h.time_waited) / 1000000, 2) AS total_wait_time_secs
FROM
dba_hist_active_sess_history h
JOIN
dba_objects o ON h.current_obj# = o.object_id
WHERE
h.event = 'db file sequential read'
AND h.sample_time >= SYSDATE - 365
AND o.object_type IN ('TABLE', 'TABLE PARTITION')
GROUP BY
o.owner, o.object_name, o.object_type
ORDER BY
total_wait_time_secs DESC
)
WHERE ROWNUM <= 5;
As we are aware which sql_ids and which are the most consuming tables, we need to direct application owners to use below appropriate options,
(1) hints(/*+ BATCH_TABLE_ACCESS_BY_ROWID(t) / , /*+ PARALLEL(t, 4) / /*+ INDEX_FFS(t your_index_name) */ indexed_column, etc).
(2) One can force parallel execution using “ALTER SESSION ENABLE PARALLEL QUERY;”.
(3) ALTER SESSION SET "_nlj_batching_enabled" = 1; and ALTER SESSION SET "_table_lookup_prefetch_size" = 16;
Or by DBAs,
(1) ALTER SYSTEM SET parallel_degree_policy = 'AUTO' SCOPE=BOTH;
These changes needs to be cross verified post implementation with AWR reports and customised queries.
Angudi Tech
Contact
Newsletter
info@anguditech.com
+91 8855068102
© 2026. All rights reserved.